Understand dependency injection

ASP.NET Core apps often need to access the same services across multiple components. For example, several components might need to access a service that fetches data from a database. ASP.NET Core uses a built-in dependency injection (DI) container to manage the services that an app uses.

Dependency injection and Inversion of Control (IoC)

The dependency injection pattern is a form of Inversion of Control (IoC). In the dependency injection pattern, a component receives its dependencies from external sources rather than creating them itself. This pattern decouples the code from the dependency, which makes code easier to test and maintain.

Consider the following Program.cs file:

C#Copy

using Microsoft.AspNetCore.Builder;
using Microsoft.AspNetCore.Http;
using Microsoft.Extensions.DependencyInjection;
using MyApp.Services;

var builder = WebApplication.CreateBuilder(args);
    
builder.Services.AddSingleton<PersonService>();
var app = builder.Build();

app.MapGet("/", 
    (PersonService personService) => 
    {
        return $"Hello, {personService.GetPersonName()}!";
    }
);
    
app.Run();

And the following PersonService.cs file:

C#Copy

namespace MyApp.Services;

public class PersonService
{
    public string GetPersonName()
    {
        return "John Doe";
    }
}

To understand the code, start with the highlighted app.MapGet code. This code maps HTTP GET requests for the root URL (/) to a delegate that returns a greeting message. The delegate’s signature defines an PersonService parameter named personService. When the app runs and a client requests the root URL, the code inside the delegate depends on the PersonService service to get some text to include in the greeting message.

Where does the delegate get the PersonService service? It’s implicitly provided by the service container. The highlighted builder.Services.AddSingleton<PersonService>() line tells the service container to create a new instance of the PersonService class when the app starts, and to provide that instance to any component that needs it.

Any component that needs the PersonService service can declare a parameter of type PersonService in its delegate signature. The service container will automatically provide an instance of the PersonService class when the component is created. The delegate doesn’t create the PersonService instance itself, it just uses the instance that the service container provides.

Interfaces and dependency injection

To avoid dependencies on a specific service implementation, you can instead configure a service for a specific interface and then depend just on the interface. This approach gives you the flexibility to swap out the service implementation, which makes the code more testable and easier to maintain.

Consider an interface for the PersonService class:

C#Copy

public interface IPersonService
{
    string GetPersonName();
}

This interface defines the single method, GetPersonName, that returns a string. This PersonService class implements the IPersonService interface:

C#Copy

internal sealed class PersonService : IPersonService
{
    public string GetPersonName()
    {
        return "John Doe";
    }
}

Instead of registering the PersonService class directly, you can register it as an implementation of the IPersonService interface:

C#Copy

var builder = WebApplication.CreateBuilder(args);
    
builder.Services.AddSingleton<IPersonService, PersonService>();
var app = builder.Build();

app.MapGet("/", 
    (IPersonService personService) => 
    {
        return $"Hello, {personService.GetPersonName()}!";
    }
);
    
app.Run();

This example Program.cs differs from the previous example in two ways:

  • The PersonService instance is registered as an implementation of the IPersonService interface (as opposed to registering the PersonService class directly).
  • The delegate signature now expects an IPersonService parameter instead of a PersonService parameter.

When the app runs and a client requests the root URL, the service container provides an instance of the PersonService class because it’s registered as the implementation of the IPersonService interface.

 Tip

Think of IPersonService as a contract. It defines the methods and properties that an implementation must have. The delegate wants an instance of IPersonService. It doesn’t care at all about the underlying implementation, only that the instance has the methods and properties defined in the contract.

Testing with dependency injection

Using interfaces makes it easier to test components in isolation. You can create a mock implementation of the IPersonService interface for testing purposes. When you register the mock implementation in the test, the service container provides the mock implementation to the component being tested.

For example, say that instead of returning a hard-coded string, the GetPersonName method in the PersonService class fetches the name from a database. To test the component that depends on the IPersonService interface, you can create a mock implementation of the IPersonService interface that returns a hard-coded string. The component being tested doesn’t know the difference between the real implementation and the mock implementation.

Also suppose your app maps an API endpoint that returns a greeting message. The endpoint depends on the IPersonService interface to get the name of the person to greet. The code that registers the IPersonService service and maps the API endpoint might look like this:

C#Copy

var builder = WebApplication.CreateBuilder(args);

builder.Services.AddSingleton<IPersonService, PersonService>();

var app = builder.Build();

app.MapGet("/", (IPersonService personService) =>
{
    return $"Hello, {personService.GetPersonName()}!";
});

app.Run();

This is similar the previous example with IPersonService. The delegate expects an IPersonService parameter, which the service container provides. As mentioned earlier, assume that the PersonService that implements the interface fetches the name of the person to greet from a database.

Now consider the following XUnit test that tests the same API endpoint:

 Tip

Don’t worry if you’re not familiar with XUnit or Moq. Writing unit tests is outside the scope of this module. This example is just to illustrate how dependency injection can be used in testing.

C#Copy

using Microsoft.AspNetCore.Mvc.Testing;
using Microsoft.Extensions.DependencyInjection;
using Moq;
using MyWebApp;
using System.Net;

public class GreetingApiTests : IClassFixture<WebApplicationFactory<Program>>
{
    private readonly WebApplicationFactory<Program> _factory;

    public GreetingApiTests(WebApplicationFactory<Program> factory)
    {
        _factory = factory;
    }

    [Fact]
    public async Task GetGreeting_ReturnsExpectedGreeting()
    {
        //Arrange
        var mockPersonService = new Mock<IPersonService>();
        mockPersonService.Setup(service => service.GetPersonName()).Returns("Jane Doe");

        var client = _factory.WithWebHostBuilder(builder =>
        {
            builder.ConfigureServices(services =>
            {
                services.AddSingleton(mockPersonService.Object);
            });
        }).CreateClient();

        // Act
        var response = await client.GetAsync("/");
        var responseString = await response.Content.ReadAsStringAsync();

        // Assert
        Assert.Equal(HttpStatusCode.OK, response.StatusCode);
        Assert.Equal("Hello, Jane Doe!", responseString);
    }
}

The preceding test:

  • Creates a mock implementation of the IPersonService interface that returns a hard-coded string.
  • Registers the mock implementation with the service container.
  • Creates an HTTP client to make a request to the API endpoint.
  • Asserts that the response from the API endpoint is as expected.

The test doesn’t care how the PersonService class gets the name of the person to greet. It only cares that the name is included in the greeting message. The test uses a mock implementation of the IPersonService interface to isolate the component being tested from the real implementation of the service.
juniper networks training courses malaysia

Introduction

When an ASP.NET Core app receives an HTTP request, the code handling the request sometimes needs to access other services. For example, a Blazor component might need to access a service that fetches data from a database. ASP.NET Core uses a built-in dependency injection (DI) container to manage the services that an app uses.

Example scenario

Suppose you’re an entry-level ASP.NET Core developer at a small company. Your team is building a new web app. The requirements accessing and displaying a customer welcome message to the user on the welcome page. Your team lead asked you to configure the necessary services for accessing the data so they can be used from the web UI components.

What will we be doing?

In this module, you use the .NET SDK to create a boilerplate ASP.NET Core web application. After ensuring it runs correctly, you’ll implement an in-memory service to generate the welcome message. You’ll then use the built-in dependency injection container to inject the service where needed.

What is the main goal?

By the end of the module, you’ll be able to create an ASP.NET Core web application that uses the built-in dependency injection container to manage services. You’ll also be able to describe the benefits of using dependency injection in an ASP.NET Core app.

kubernetes training courses malaysia

Configure services with dependency injection in ASP.NET Core

Understand and implement dependency injection in an ASP.NET Core app. Use ASP.NET Core’s built-in service container to manage dependencies. Register services with the service container.

Learning objectives

By the end of this module, you’ll be able to:

  • Describe the role of the service container in an ASP.NET Core app.
  • Register services with the service container.
  • Retrieve services from the service container in C# code.

lean it certification training courses malaysia

Retrieve application log files

Log files are a great resource for a Web developer, but only if you know how to find and use the logged information. Here, you look at the methods you can use to retrieve logged information for offline analysis.

Log file storage locations

The Azure infrastructure used to run Azure Web Apps in Windows isn’t the same as for Linux apps, and log files aren’t stored in the same locations.

Windows app log files

For Windows apps, file system log files are stored in a virtual drive that is associated with your Web App. This drive is addressable as D:\Home, and includes a LogFiles folder; within this folder are one or more subfolders:

  • Application – Contains application-generated messages, if File System application logging is enabled.
  • DetailedErrors – Contains detailed Web server error logs, if Detailed error messages are enabled.
  • http – Contains IIS-level logs, if Web server logging is enabled.
  • W3SVC<number> – Contains details of all failed http requests, if Failed request tracing is enabled.

Where storage to a Blob container is enabled, logs are stored in year, month, date, and hour folders, for example:Copy

2019
  01
   10
    08 - log entries for the period 08:00:00 to 08:59:59 on January 10th 2019
    09 - log entries for the period 09:00:00 to 09:59:59 on January 10th 2019

Within the hour folder, there are one or more CSV files containing messages saved within that 60-minute period.

Linux app log files

For Linux Web Apps, the Azure tools currently support fewer logging options than for Windows apps. Redirections to STDERR and STDOUT are managed through the underlying Docker container that runs the app, and these messages are stored in Docker log files. To see messages logged by underlying processes, such as Apache, you need to open an SSH connection to the Docker container.

Methods for retrieving log files

How you retrieve log files depends on the type of log file, and on your preferred environment. For file system logs, you can use the Azure CLI or the Kudu console. Kudu is the engine behind many features in Azure App Service related to source control based deployment.

Azure CLI

To download file system log files using the Azure CLI, first copy the log files from the app’s file system to Cloud Shell storage, and then run the following command.

Azure CLICopy

az webapp log download --log-file \<_filename_\>.zip  --resource-group \<_resource group name_\> --name \<_app name_\>

To download the zipped log files to your local computer, use the file download and upload tool in the Cloud Shell toolbar. Once downloaded, the files are ready for opening in Microsoft Excel, or other apps.

 Note

The Azure CLI download includes all app logs, except for failed request traces.

Kudu

There’s an associated Source Control Management (SCM) service site associated with all Azure Web Apps. This site runs the Kudu service, and other Site Extensions. It’s Kudu that manages deployment and troubleshooting for Azure Web Apps, including options for viewing and downloading log files. The specific functionality available in Kudu, and how you download logs, depends on the type of Web App. For Windows apps, you can browse to the log file location, and then download the logs. For Linux apps, there might be a download link.

One way to access the Kudu console is to navigate to https://<app name>.scm.azurewebsites.net, and then sign in using deployment credentials.

You can also access Kudu from the Azure portal. On the App Service menu, under Development Tools, select Advanced Tools, and then on the Advanced Tools pane, select Go to open a new Kudu Services tab.

To download the log files from Windows apps:

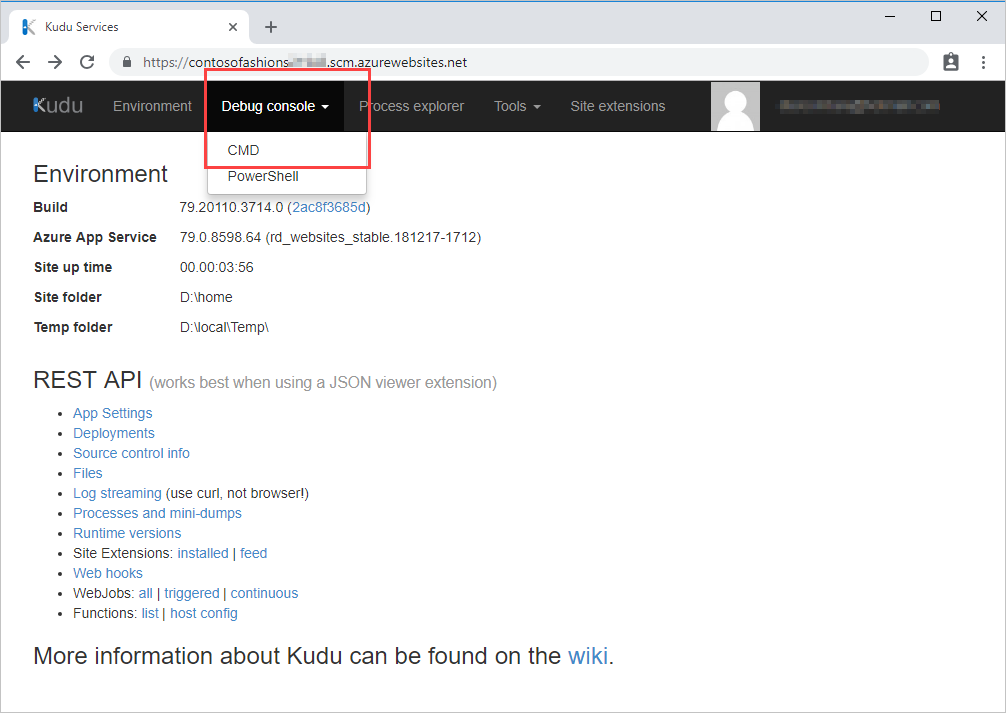
  1. Select Debug Console, and then select CMD.Screenshot of Kudu's environment page with a callout highlighting the Debug Console cmd menu option.
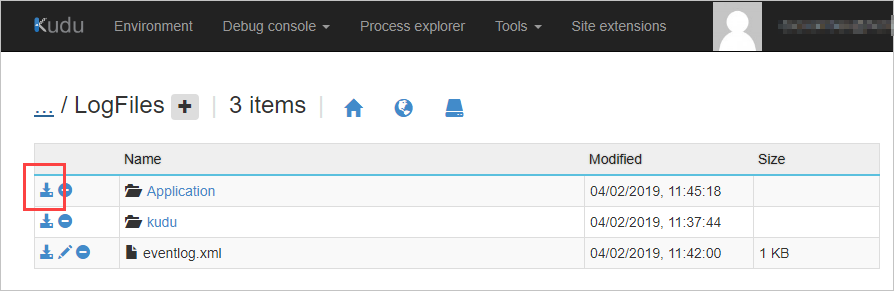
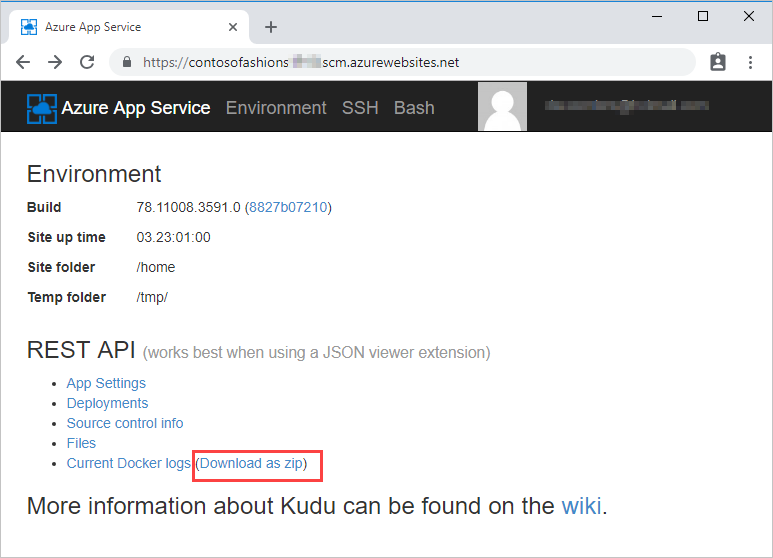
  2. In the file explorer section, select LogFiles, and for the Application folder, select Download. The logs are downloaded to your computer as Application.zip.Screenshot of Kudu's user interface. It displays a file and folder listing with a highlight next to the download icon for the Application folder.For Linux apps, select the download link on the Environment page.Screenshot of Kudu's user environment page with a callout highlighting the link to download a zip file containing the current Docker logs.
Azure Storage browser

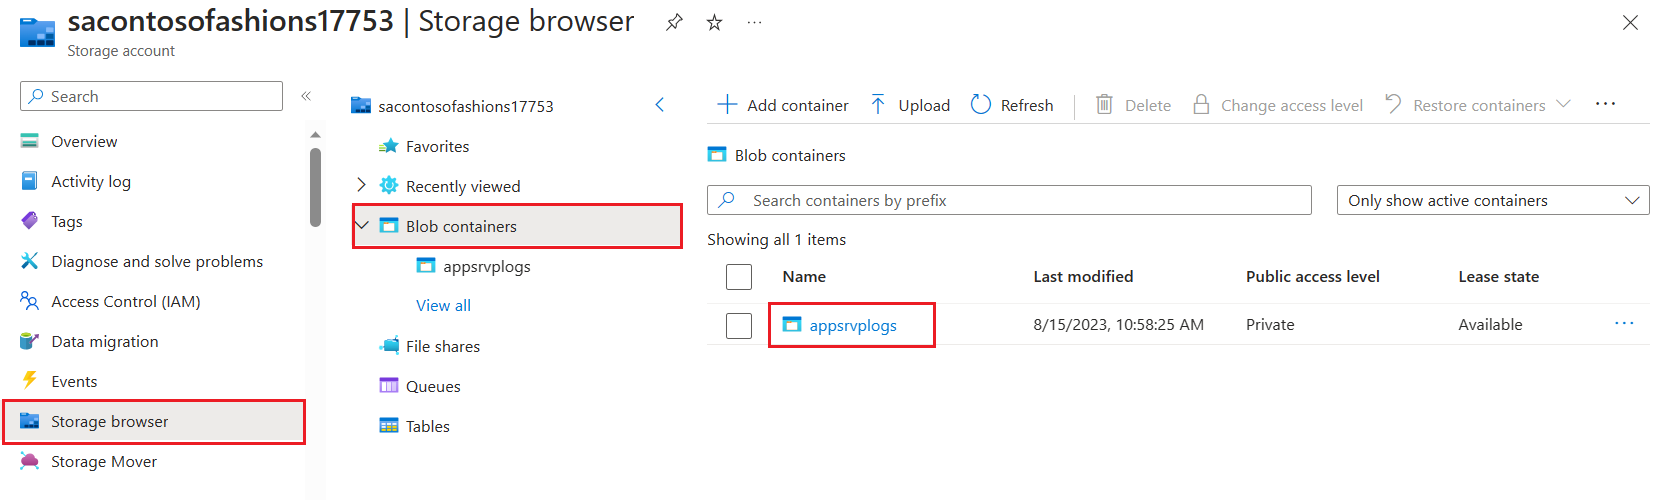
To access Windows logs saved to an Azure Blob Storage container, you can use the Azure portal. To view and download the contents of the log file container, select Storage accounts from the portal menu. Select your storage account and then select Storage browser. Open the type of storage container (for example, Blob containers), and select the name of the blob container that contains the log file. Inside the container, open the relevant year, month, date, and hour folder, then double-click a CSV file to download it to your computer.

Screenshot of the Storage browser to download Windows app logs from blob containers.

If you have Microsoft Excel on your computer, the log file automatically opens as an Excel worksheet. Otherwise, you can open the file using a text editor, such as Notepad.

jboss enterprise application platform training courses malaysia

View live application logging with the log streaming service

In this unit, you look at how to view a live app log stream, and how live log streams can help during Web app development.

What is live log streaming?

Live log streaming is an easy and efficient way to view live logs for troubleshooting purposes. Live log streaming provides a quick view of all the messages sent to the app logs in the file system, without having to go through the process of locating and opening the logs. To use live logging, you connect to the live log service from the command line, and you can then see text being written to the app’s logs in real time.

What logs can be streamed?

The log streaming service adds a redirect from the file system logs, so that you see the same information that is saved to the log files. So, if you enable verbose logging for ASP.NET Windows apps, for example, the live log stream shows all your logged messages.

Screenshot of Azure portal live log stream pane showing output from the asp logs container.

Typical scenarios for using live logging

Live logging is a useful tool for initial debugging. Real time log messages give you immediate feedback for code or server issues. You can then make a change, redeploy your app, and instantly see the results.

The live log stream connects to a single app instance, so it’s not useful if you have a multi-instance app. Live logging is also of limited use as you scale up your apps. In these scenarios, it’s better to ensure that messages are saved to log files that can be opened and studied offline.

How to use live log streaming

You can enable live log streaming from the command line, in a Cloud Shell session directly from the Azure portal. There are two options: Azure CLI or curl commands.

Azure CLI

To open the log stream, run the following command.

azcliCopy

az webapp log tail --name <app name> --resource-group <resource group name>

To stop viewing live logs, press Ctrl+C.

Curl

To use Curl, you need FTPS credentials. There are two types of FTPS credentials:

  • Application scope. Azure automatically creates a username/password pair when you deploy a Web app, and each of your apps has their own separate set of credentials.
  • User scope. You can create your own credentials for use with any Web app. You can manage these credentials in the Azure portal, as long as you already have at least one Web app, or by using Azure CLI commands.

Azure portal UI

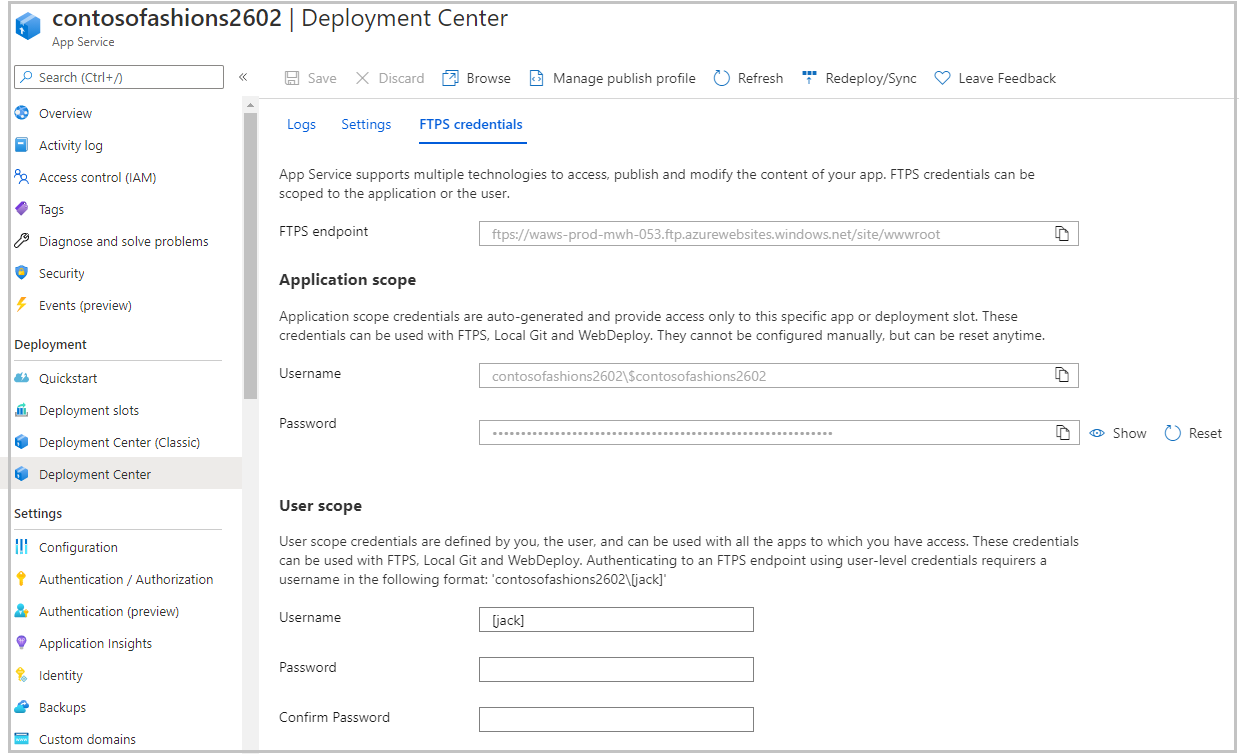
To view and copy these details from the Azure portal, in the App Service menu, under Deployment, select Deployment Center, and then select the FTPS credentials tab.

Screenshot of the App Service Deployment Center pane showing FTPS credentials tab.

Reset user-level credentials

To create a new set of user-level credentials, run the following command in the Cloud Shell.

azcliCopy

az webapp deployment user set --user-name <name-of-user-to create> --password <new-password>

 Note

Usernames must be globally unique across all of Azure, not just within your own subscription or directory.

After you create a set of credentials, run the following command to open the log stream. You’re then prompted for the password.

azcliCopy

curl -u {username} https://{sitename}.scm.azurewebsites.net/api/logstream

To close an active log stream session, press Ctrl+C.

iot training courses malaysia

Enable and configure App Service application logging

In this unit, we look at how app logging can help with your Web apps, and show you how to enable app logs.

What are app logs?

Azure provides built-in diagnostics with app logging. App logs are the output of runtime trace statements in app code. For example, you might want to check some logic in your code by adding a trace to show when a particular function is being processed. Or, you might only want to see a logged message when a particular level of error occurs. App logging is primarily for apps in preproduction and for troublesome issues, because excessive logs can carry a performance hit and quickly consume storage. For this reason, logging to the file system is automatically disabled after 12 hours.

App logging has scale limitations, primarily because files are being used to save the logged output. If you have multiple instances of an app, and the same storage is shared across all instances, messages from different instances might be interleaved, making troubleshooting difficult. If each instance has its own log file, then there are multiple logs, again making it difficult to troubleshoot instance-specific issues.

The types of logging available through the Azure App Service depends on the code framework of the app, and on whether the app is running on a Windows or Linux app host.

ASP.NET

ASP.NET apps only run on Windows app services. To log information to the app diagnostics log, use the System.Diagnostics.Trace class. There are four trace levels you can use, that correlate with the errorwarninginformation, and verbose logging levels shown in the Azure portal:

  • Trace.TraceError(“Message”); // Writes an error message
  • Trace.TraceWarning(“Message”); // Writes a warning message
  • Trace.TraceInformation(“Message”); // Writes an information message
  • Trace.WriteLine(“Message”); // Writes a verbose message

ASP.NET Core apps

ASP.NET Core apps can run on either Windows or Linux. To log information to Azure app logs, use the logger factory class, and then use one of six-log levels:

  • logger.LogCritical(“Message”); // Writes a critical message at log level 5
  • logger.LogError(“Message”); // Writes an error message at log level 4
  • logger.LogWarning(“Message”); // Writes a warning message at log level 3
  • logger.LogInformation(“Message”); // Writes an information message at log level 2
  • logger.LogDebug(“Message”); // Writes a debug message at log level 1
  • logger.LogTrace(“Message”); // Writes a detailed trace message at log level 0

For ASP.NET Core apps on Windows, these messages relate to the filters in the Azure portal in this way:

  • Levels 4 and 5 are error messages.
  • Level 3 is a warning message.
  • Level 2 is an information message.
  • Levels 0 and 1 are verbose messages.

For ASP.NET Core apps on Linux, only error messages (levels 4 and 5) are logged.

Node.js apps

For script-based Web apps, such as Node.js apps on Windows or Linux, app logging is enabled using the console() method:

  • console.error(“Message”); // Writes a message to STDERR.
  • console.log(“Message”); // Writes a message to STDOUT.

Both types of message are written to the Azure app service error level logs.

Logging differences between Windows and Linux hosts

To route messages to log files, Azure Web apps use the Internet Information Services (IIS) Web server. Because Windows-based Web apps are a well-established Azure service, and messaging for ASP.NET apps is tightly integrated with the underlying IIS service, Windows apps benefit from a rich logging infrastructure. For other apps, logging options are limited by the development platform, even when running on a Windows app service.

The Docker image used for the app’s container, determines the logging functionality available to Linux-based scripted apps, such as Node. Basic logging, such as using redirections to STDERR or STDOUT, uses the Docker logs. Richer logging functionality is dependent on the underlying image, and whether it’s running PHP, Perl, Ruby, and so on. To download equivalent Web application logging as provided by IIS for Windows apps, might require connecting to your container using SSH.

The following table summarizes the logging support for common app environments and hosts.

App environmentHostLog levelsSave location
ASP.NETWindowsError, Warning, Information, VerboseFile system, Blob storage
ASP.NET CoreWindowsError, Warning, Information, VerboseFile system, Blob storage
ASP.NET CoreLinuxErrorFile system
Node.jsWindowsError (STDERR), Information (STDOUT), Warning, VerboseFile system, Blob storage
Node.jsLinuxErrorFile system
JavaLinuxErrorFile system

Alternatives to app diagnostics

Azure Application Insights is a site extension that provides more performance monitoring features, such as detailed usage and performance data. Application Insights is designed for production app deployments and is a potentially useful development tool. It works with a range of app development environments, providing the same set of rich telemetry and performance data whether the app is ASP.NET or Node. However, to make use of Application Insights, you have to include specific code within your app, using the App Insights SDK. Application Insights is also a billable service. So, depending on the scale of your app deployments and data collected, you might need to plan for regular costs.

You can also view Metrics for your app, which can help you profile how your app is operating. These counters are useful in production and development. You can view CPU, memory, network, and file system usage, and set up alerts when a counter hits a particular threshold. Billing for metrics is covered by the app service plan tier.

Enable logging using the Azure portal

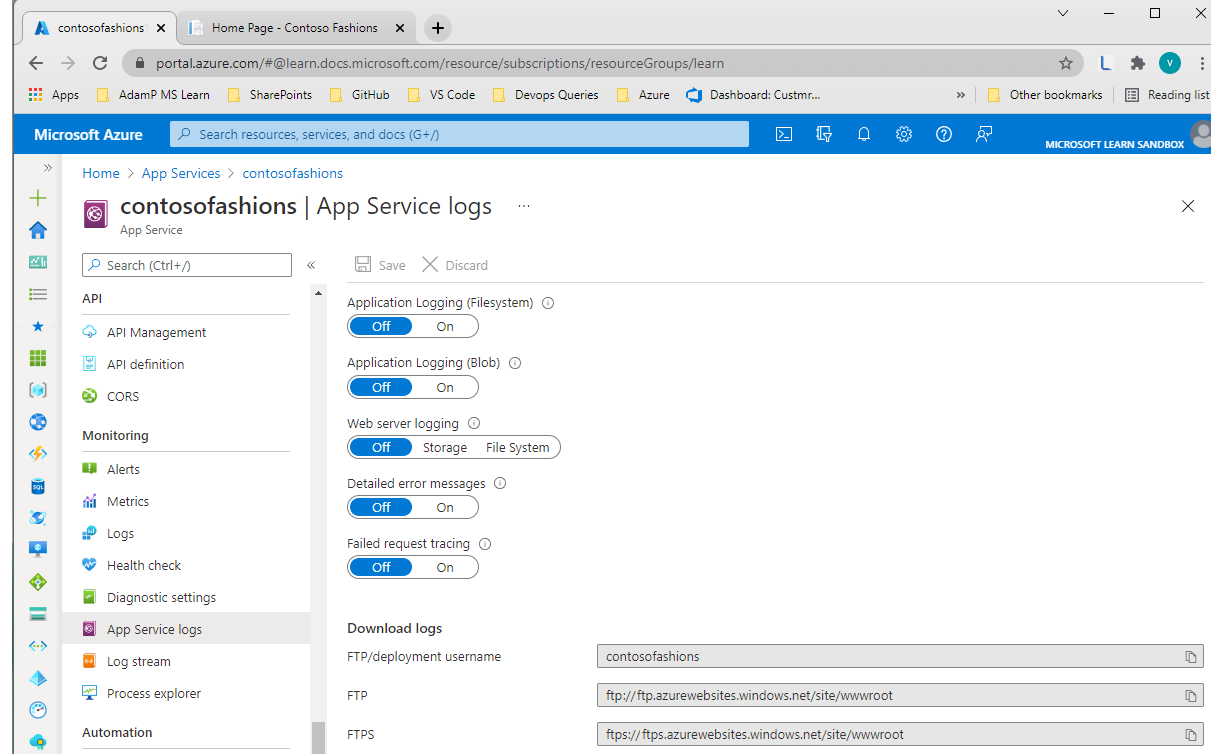
In the portal, app logging is managed from the Diagnostics logs pane of the web app.

Screenshot of Diagnostics logs pane in the Azure portal.

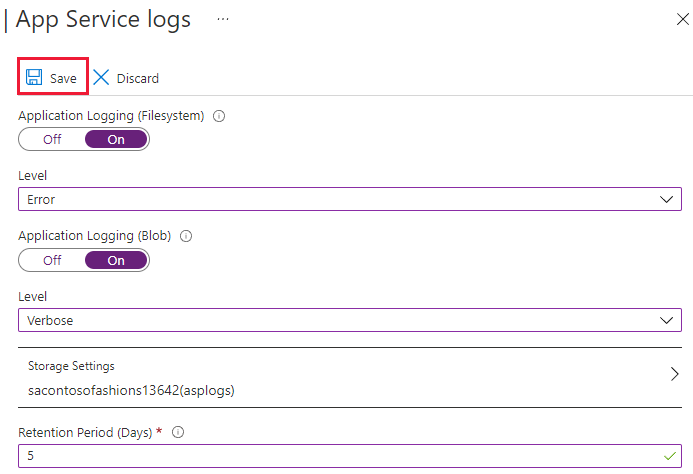
To enable app logging to the Web app’s file system, set Application logging (Filesystem) to On, and then set the Level to Error, Warning, Information, or Verbose. Logging to the file system will be automatically reset to Off after 12 hours.

To enable app logging to a blob storage container, set Application logging (Blob) to On, and then select a storage account and container. The storage account and Web app must be created in the same Azure region. You then set the Level to Error, Warning, Information, or Verbose.

 Note

Saving to blob storage is not available for Linux app logs.

When logging to blob storage, you must also set a Retention Period. Unlike the file system logs, blob logs are never deleted by default. The retention period option means that any logs older than the specified number of days are deleted.

Screenshot of configuring application logs in the Azure portal with Save highlighted.

After configuring the logs, select Save.

Enable logging using the Azure CLI

To enable app logging to the file system, run this command.

Azure CLICopy

az webapp log config --application-logging filesystem --level verbose --name <app-name> --resource-group <resource-group-name>

For example, to enable logging to the file system for an app called contosofashions123, capturing all messages, run this command.

Azure CLICopy

az webapp log config --application-logging filesystem --level verbose --name contosofashions123 --resource-group contosofashionsRG

There’s currently no way to disable application logging by using Azure CLI commands. However, the following command resets file system logging to error-level only.

Azure CLICopy

az webapp log config --application-logging off --name <app-name> --resource-group <resource-group-name>

To view the current logging status for an app, use this command.

Azure CLICopy

az webapp log show --name <app-name> --resource-group <resource-group-name>

checkpoint certification malaysia

Introduction

Suppose you’re the lead web developer for an online fashion site hosted on Azure Web Apps. The company is rolling out a major rebranding, and is using the rebranding as an opportunity to bring new purchasing, tracking, and social media features to the company’s online presence. The company won several prestigious and influential industry and consumer awards for the high standard of its current online customer experience. So, it’s essential that when the new apps go live, there are no unexpected performance or functionality issues. You have an app in development and, during this early stage of the dev cycle, you want a simple and easy way to capture basic app logging output without adding a specialized SDK, such as Azure Application Insights.

In this module, to record traces in your web apps, you learn how to enable app logging, monitor a live log stream, and retrieve logs from Azure.

Learning objectives

By the end of this module, you’re able to:

  • Enable app logging on an Azure Web App.
  • View live app logging activity with the log streaming service.
  • Retrieve app log files from an app with Kudu or the Azure CLI.

Prerequisites

  • Experience in basic web app development and deployment, including creating trace output from apps.
  • Knowledge of how to navigate resources in the Azure portal.

cisco certification malaysia

Capture Web Application Logs with App Service Diagnostics Logging

Use application logs in Azure Web Apps for debugging web app code.

Learning objectives

In this module, you will:

  • Enable application logging on an Azure Web App
  • View live application logging activity with the log streaming service
  • Retrieve application log files from an application with Kudu or the Azure CLI

Prerequisites

  • Experience in basic web app development and deployment, including creating trace output from applications
  • Understanding of Web apps in Microsoft Azure

citrix certification malaysia 2

Scale up a web app

Scaling out enables you to run more instances of a web app. The pricing tier determines resources available to each instance used by the App Service plan that hosts the web service. Each pricing tier specifies the computing power provided, together with the memory and maximum number of instances that can be created.

If you initially deploy a web app using a relatively cheap pricing tier, you might find the resources are sufficient to start with. But the resources might become too limited if demand for your web service grows, or if you add features that require more power. In this case, you can scale up to a more powerful pricing tier.

In the hotel reservation system, you notice a steady increase in the number of visitors, beyond the variations caused by special offers or events. Your company is adding more features to the web app that require more resources. You’re nearing the scale-out limits of your current App Service plan pricing tier, so you need to scale up to a tier that provides more instances and more powerful hardware.

In this unit, you learn how to scale up the web app to meet the increasing resource requirements.

App Service plan pricing tiers and hardware levels

The different pricing tiers available for App Service plans offer various levels or resources. The Basic, Standard, and Premium tiers are based on A-Series virtual machines that have different amounts of memory and IO capacity. The PremiumV2 and Isolated tiers are based on Dv2-Series virtual machines. Each of these tiers has three hardware levels, roughly corresponding to 1, 2, and 4 CPUs. For detailed information about the pricing tiers and hardware levels.

Scale up a web app

You scale an App Service plan up and down by changing the pricing tier and hardware level that it runs on. You can start with the Free tier and scale up as needed according to your requirements. This process is manual. You can also scale down again if you no longer need the resources associated with a particular tier.

Scaling up can cause an interruption in service to client apps running at the time. They might need to disconnect from the service and reconnect if the scale-up occurs during an active call to the web app. New connections might be rejected until scaling finishes. Also, scaling up can cause the outgoing IP addresses for the web app to change. If your web app depends on other services that have firewalls restricting incoming traffic, you need to reconfigure these services.

As with scale-out, you should monitor the performance of your system to ensure that scaling up or down has the desired effect. It’s also important to understand that scale up and scale out can work cooperatively together. If you scale out to the maximum number of instances available for your pricing tier, you must scale up before you can scale out further.

comptia certification malaysia

Scale a web app manually

By manually scaling out and back in again, you can respond to expected increases and decreases in traffic. Scaling out has the extra benefit of increasing availability because of the increased number of instances of the web app. A failure of one instance doesn’t make the web app unavailable.

In the hotel reservation system, you can scale out before an anticipated seasonal influx. You can scale back in when the season is over and the number of booking requests is reduced.

In this unit, you learn how to manually scale out a web app and how to scale it back in.

App Service plans and scalability

A web app that runs in Azure typically uses Azure App Service to provide the hosting environment. App Service can arrange for multiple instances of the web app to run. It load balances incoming requests across these instances. Each instance runs on a virtual machine.

An App Service plan defines the resources available to each instance. The App Service plan specifies the operating system (Windows or Linux), the hardware (memory, CPU processing capacity, disk storage, and so on), and the availability of services like automatic backup and restore.

Azure provides a series of well-defined App Service plan tiers. This list summarizes each of these tiers, in increasing order of capacity and cost:

  • The Free tier provides 1 GB of disk space and support for up to 10 apps, but only a single shared instance and no SLA for availability. Each app has a compute quota of 60 minutes per day. The Free service plan is suitable for app development and testing rather than production deployments.
  • The Shared tier provides support for more apps (up to 100) also running on a single shared instance. Apps have a compute quota of 240 minutes per day. There’s no availability SLA.
  • The Basic tier supports an unlimited number of apps and provides more disk space. Apps can be scaled out to three dedicated instances. This tier provides an SLA of 99.95% availability. There are three levels in this tier that offer varying amounts of computing power, memory, and disk storage.
  • The Standard tier also supports an unlimited number of apps. This tier can scale to 10 dedicated instances and has an availability SLA of 99.95%. Like the Basic tier, this tier has three levels that offer an increasingly powerful set of computing, memory, and disk options.
  • The Premium tier gives you up to 20 dedicated instances, an availability SLA of 99.95%, and multiple levels of hardware.
  • The Isolated tier runs in a dedicated Azure virtual network, which gives you a network and computes isolation. This tier can scale out to 100 instances and has an availability SLA of 99.95%.

 Note

Some tiers aren’t available for all operating systems. For example, there is currently no Shared tier for Linux.

Monitor and scale a web app

When you create a web app, you can either create a new App Service plan or use an existing one. If you select an existing plan, any other web apps that use the same plan share resources with your web app. They all scale together, so they need to have the same scaling requirements. If your apps have different requirements, use a separate App Service plan for each one.

You scale out by adding more instances to an App Service plan, up to the limit available for your selected tier. If you’re not using the Free tier, you’re charged for each instance on an hourly basis. You can perform this task in the Azure portal.

The key to scaling effectively is knowing when to scale, and by how much. You monitor the performance of a web app by using the metrics available for the App Service. The simplest way to do this task is to use the Azure portal.

If you notice a steady increase in resource use, such as CPU utilization, memory occupancy, or disk queue length, you should consider scaling out before these metrics hit a critical point. You should also monitor the average response time of requests and the number of failing requests. If both of these figures are high, the system might be running close to or beyond capacity. You might need to scale out immediately.

If the metrics indicate that your system is lightly loaded and has plenty of spare capacity, you might want to scale back in to reduce costs.

In both cases, you should continue to monitor the statistics for the web app. Allow the system to stabilize. If the metrics indicate that the app is still underpowered or overpowered, add or remove instances as needed.

dell emc certification malaysia